Sunday, August 31, 2008

Helmsman Rebuttal, Part II

Quoting “Helmsman”:

“George Bush — as the mounting evidence is showing — duped the Congress and the American people into a war that has so far left over 4,000 of our kids dead, for no good reason”
This is just too ignorant to take seriously (except, of course, in the case of those who blindly accept what so-called “journalists” tell them).

Just read the post and all the associated links.

If you read all that and still believe the “Bush Lied” meme, then you are simply beyond help.


Helmsman Rebuttal

Quoting “Helmsman”:

“The Clinton administration left George W. Bush with the largest budget surplus in the history of the Republic. George Bush will leave the next President with the largest budget deficit in the history of the Republic. It's not silly to call that malfeasance.”
I would not defend Bush 43 as a fiscal Conservative. He did, after all, sign into law the largest expansion of Entitlements since LBJ.

But, those who regurgitate such shallow propaganda fail to understand the fundamental facts.

It is intuitively obvious that Medicare & Medicaid (both signed into law in 1965) are what sent this country on a path to never ending deficit spending.

Prior to those new Entitlements (excepting for World War II, which is not covered in this database), only two recessions produced ANY deficit spending. Subsequent to LBJ’s 1965 Entitlement binge, deficit spending became the ever expanding norm.

Click the image to enlarge and view the source:
Click the image to enlarge and view the source


The only significant exception to this new norm (mid 1997 to mid 2001) was brought about by the single largest speculative bubble ever known to humanity (the dot.com bubble). Clinton was the unwitting beneficiary of unprecedented revenues from day traders paying a small fortune in short term capital gains taxes.

Click the image to enlarge this chart of the NASDAQ bubble:
Click the image to enlarge
Click here to reproduce the above chart.
Select a custom time frame from 1/2/92 to 10/17/2002.


Clinton also benefited from serving the last 6 of his 8 years under a fiscally Conservative Congress dominated by Republicans in both houses. Aside from that, Clinton realized some additional savings by gutting our military (another area where Bush 43 had to pay the piper).

Defense spending as a percentage of GDP, click the chart to learn more:
Click the chart to learn more


2000 through mid 2003 witnessed substantial decreases in “Net Government Saving”.

Click the image to enlarge and view the source:
Click the image to enlarge and view the source


These deficits were exacerbated by:

1) The years long deflating of the NASDAQ bubble.

2) The terrorist attacks of 9/11/01.

3) The associated recession.

But, the real underlying culprit was the 800 lb. Gorilla that President Bush tried to address and which Congress was too cowardly to take on (Entitlement Reform). Whoever wins in November will inherit the same problem and, absent sweeping Entitlement reform, will produce similar deficits.

Clinton was not some economic genius who magically created giant surpluses from giant deficits (or wine from water). Clinton and crew were the unwitting beneficiaries of the single largest speculative bubble in the entire history of humanity. His surpluses were entirely a function of the giant capital gains taxes being paid by day traders full of “irrational exuberance”.

Bush 43 was merely the poor sap who got to pay the piper and suffer the hangover once the party was over.

Oh, and about all those jobs created under the Clinton administration…
Most of those jobs were as illusory as the “new economy” “new paradigm” where “eyeballs” on your web site replaced any need for profits. And, Bush 43, again, was the poor sap who paid that piper as well. The sock puppet is the only employee from Pets.com that still has a job created under Clinton. And Pets.com is a good example in microcosm for the fate of a large chunk of the purely illusory jobs created during the Clinton years.

Now that the party is over, we’re right back where we started from. We’re drowning in Entitlement spending. It WILL kill the goose that laid the golden egg:

Click the image to view the source:
Click the image to view the source
Or, click here and read the CBO report.


Worse still, history PROVES we CANNOT tax our way out of this problem.

Think higher tax rates produce higher tax revenues?
Read about the (well proven) Laffer Curve & think again!
Click the image & read the facts:

Click the image & read the facts


Obama is promising MASSIVE new Entitlements at a time when it is a mathematical CERTAINTY that existing Entitlements are utterly unsustainable and WILL KILL US!


Silly is as Silly Does

Quoting Steven Hofman:

“Mr. Lawrence owes his readers a trace more
thought and research before he puts silliness in print”
I wonder…
Has Mr. Hofman mistaken SP&T for a serious newspaper?

SP&T is, in my view, just a cheap propaganda rag pimping for the so-called “Liberal” agenda.
As far as I can tell, they don’t even pretend to be anything else.

But, kudos to Mr. Hofman for taking the “Socialist Position & Trash” to task!


Wednesday, August 27, 2008

The Steamboat Forum

When I attempt to so much as visit (not attempt to log into) The Steamboat Forum I now get the following message:

“You have been permanently banned from this board.
Please contact the Board Administrator for more information.
Reason given for ban: trolling
A ban has been issued on your IP address.”
I am no longer allowed to so much as read the forum. Geez! In my view, The Steamboat Forum makes SP&T look downright Libertarian!

Suffice to say, I could not more strongly disagree with both the ban and the reason given. This ban boiled down to a dispute over the circumstances under which I would or would not be allowed to post a link to my blog as a means of substantiating (or making) my point. I was abiding by the Admin ruling while discussing and debating the issue when, out of nowhere, came the ban.

But, it’s no great loss.

Mr./Ms. Admin:
Rest assured, I will never again attempt to reregister at your site (although it would be easy enough to do). Your board, your rules. You have that right. And I have lost any desire I ever had to participate in your forum.

Sunday, August 24, 2008

Richard Levy & Baghdad Bob

Quoting Richard Levy (August 24, 2008 at 8:40 p.m.):

“I can believe that when Steamboat residents completed their surveys, ‘Affordable Housing’ may not have been their top concern . Residents may be comfortable because our community has made remarkable strides in addressing this issue.”
Hmm, I wonder why Baghdad Bob comes to mind? Maybe because Socialist Housing in Steamboat was tyrannically imposed on a quantifiably unwilling majority and has been, as always, an abysmal failure? I will document all that later. For now…

Click the image & read the rest:
Click the image & read the rest


Sunday, August 17, 2008

Steve Lewis Strikes Again

Quoting Steve Lewis:
“Please consider either stopping it [Conservative commentary]
or placing some standard on their tripe.”
Click the image
& read the quote in context:
Click the image & read the quote in context
Click here for the source of the image.

Mr. Lewis, you and your ilk have already succeeded in driving virtually all Conservative commentators out of the SP&T Reader Forum. As the previous link notes, you and your ilk encouraged the virtual book burning of every bit of community dialog I ever contributed to the SP&T Reader Forum. If you drum Conservatives out of letter to the editor pages, what’s next?

Where will your politically motivated (and astonishingly hypocritical) censorship end?

8/18/08 Update:
Steve Lewis further reveals what makes him happy:
“I like the new blog… It looks like the main difference with ‘less’ anonymous participation is the once conservative majority has bailed?”
Anybody surprised at what makes Mr. Lewis happy? I’m not!

First, there is no longer ANY “anonymous participation”!
SP&T now DEMANDS that ALL posters reveal their identity to THEM!

UPDATE: As of 2/20/2012, SP&T now requires all commenters to reveal their true identity to every emotionally unstable political extremist with access to a computer.

Second, a DRAMATIC reduction in the number of Conservative posters is PRECISELY what I predicted would happen and PRECISELY what I asserted was the primary goal of the far, far, FAR LEFT SP&T!

If ANYBODY finds it surprising that only ONE conservative poster (thus far) was naïve enough to trust SP&T with their identity, they must not understand the true nature of the FAR LEFT!

Friday, August 15, 2008

Tacit Admission Without a Formal Correction?

1/30/09 Update:

1) On 12/11/08, the NBER declared a recession began in December, 2007.

2) This declaration was very controversial.

3) In my opinion, this was a declaration driven more by political considerations than economic considerations. I don’t dispute that we are now in a recession. I dispute when it began.

4) Anyone who thinks this controversial declaration from the NBER vindicates the “journalistic sins” I describe below does not understand the first thing about journalistic standards (which no longer exist).

End of update.

Last March, SP&T committed the journalistic “sin” of embedding opinion inside straight news by describing:

“The recession of the national economy”
Today, SP&T seems to have backed off of that assertion and now describes a:
“weakened economy”
Is this a tacit admission that SP&T was out of line last March? If so, why not admit the mistake and publish the correction? As far as I can tell, SP&T has not yet done so.

The data suggest that it is currently objectively and quantitatively accurate to describe a “weakened economy”. The same data suggest that it is a virtual certainty that the economy was NOT in a recession at the time that SP&T declared, in a “straight news” entry, that it was.

Does SP&T intend to wait until the NBER declares the next recession before admitting their mistake? Will they even admit it then?

Again, the primary journalistic “sin” was the stealth embedding of opinion inside “straight news”. That alone warranted the printing of a correction. The data increasingly suggest that a correction may now be needed for having printed a blatant falsehood!

The longer SP&T delays, the greater will be the tarnish on (in my view) their already soiled reputation.

Oh, did I mention that SP&T banned me from their Reader Forum (apparently for the “thought crime” of daring to challenge their editor on this topic)?

Click the image and read my original commentary:
Click the image and read my original commentary
Remember, the cover-up is always worse than the crime!
The professional thing to do would be to admit the mistake.


Wednesday, August 13, 2008

Pollution from Coal Fired Power Plants

Quoting Steve Lewis:

“Coal pollution is causing asthma related illnesses
in cities and acid rain in forests.”
Let’s fact check that assertion.

Yes, the EPA identifies SO2, NO2 and Particulate Matter as
coal related pollutants contributing to both asthma and acid rain.

But, the following EPA chart shows that SO2, NO2 and PM
are FAR below the National Standards and are
DROPPING LIKE A ROCK!
Click here for the entire report.
Click the image to enlarge:
Click the image to enlarge


These pollutants have dropped substantially even as
the amount of coal consumed for electricity generation has increased.
Click the image to enlarge:
Click the image to enlarge
I personally created and uploaded the above chart.
The data used in the above chart are found in
this spreadsheet (Summary Statistics for the United States)
downloaded from this page.


And, there is a regulatory program in place
which promises to further reduce these pollutants.

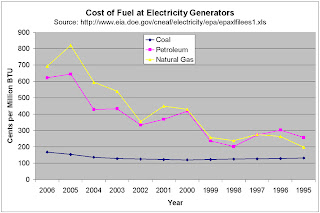
Coal is BY FAR our most economical way to generate electricity.
This is becoming more true with every passing year.
Click the image to enlarge:
Click the image to enlarge
I personally created and uploaded the above chart.
The data used in the above chart are found in
this spreadsheet (Summary Statistics for the United States)
downloaded from this page.


The United States has TREMENDOUS Coal Reserves.
Click the image to enlarge:
Click the image to enlarge
I personally created and uploaded the above chart.
The data used in the above chart are found in
this spreadsheet (International Data, Coal, Reserves)
downloaded from this page.


The truly “smart” idea is to CONTINUE the
remarkable progress in clean coal technologies.

Click the image and read about ongoing
advances in clean coal technologies:
Click the image and read about ongoing advances in clean coal technologies

We should, however, abandon the absurdly expensive and utterly unnecessary efforts to sequester CO2. Anyone who does not yet understand why, should click the next image and thereby begin their deprogramming process.

Worried about Climate Change? Don’t!
Click the image and learn the facts as described by
directly cited peer reviewed science, IPCC Scientists and more:
Click the image and learn the facts as described by directly cited peer reviewed science, IPCC Scientists and more


To blindly embrace a totalitarian political religion which requires us to abandon all
hydrocarbon based energy sources is FAR from being a “smart” approach (as Steve Lewis alleges)!


Click here to learn more.


Sunday, August 10, 2008

Global Weirding? Seriously?

It is refreshing to see Mr. Wallace acknowledge:
“The absence of absolute scientific proof that
human activity is changing the climate”
.
It’s a start.

Click the image and read the rest of
the latest letter to the editor from
William Wallace:

 Click the image and read the rest of the latest letter to the editor from William Wallace


“overwhelming evidence and credible scientific opinion”?
Where? From whom? The Purely Political IPCC? James Hansen? So-called “journalists”? Don’t make me laugh!

“Scientific Certainty Argumentation Method”?
Mr. Wallace, with a false air of authority, asserts that:

“Henry is employing a tactic that the literature calls the Scientific Certainty Argumentation Method — SCAM for short”
A Google search is pretty revealing as regards the level of authority this SCAM allegation carries.

The Precautionary Principle
As the peer reviewed scientific evidence against any catastrophic human caused warming continues to pile up, alarmists, including Mr. Wallace, are increasing turning to “The Precautionary Principle” as their new rationale for promoting drastically destructive measures.

The new argument is essentially this:
Okay, the peer reviewed science increasingly does not support the fear mongering (and never has). But, IF it WERE true, it would be really, really bad. So, we need to take all these drastically destructive measures just to be on the safe side.

First, we know, with increasing certainty, that we could burn all the hydrocarbons on the entire planet and never suffer any meaningful consequences from atmospheric CO2. If anything, the very slight additional warming would be a net positive for virtually all living things.

Second, The Precautionary Principle was applied with respect to DDT. The result was that about 35 million Africans died needlessly from Malaria. More recently, the World Health Organization has FINALLY understood the serious mistake and has lifted the DDT ban.

For more on DDT, click here and here. To begin to understand the parallels between the consequences of DDT hysteria and the consequences of Global Warming hysteria, click here.

In an effort to bolster his Precautionary Principle argument, Mr. Wallace mentions hurricane Katrina. Well, here are some “inconvenient” United States hurricane facts:

1) Deadliest US Hurricane - Galveston, 1900

2) Most Intense US Hurricane - Florida Keys, 1935

3) Decade with the most “major” US hurricanes - 1941-1950, 10

4) Most “major” US hurricanes in a single year - 1950, 8

Furthermore, quoting this source, describing yet another leading alarmist who is coming around to the side of reason (emphasis mine):

“One of the most influential scientists behind the theory that global warming has intensified recent hurricane activity says he will reconsider his stand.

The hurricane expert, Kerry Emanuel of the Massachusetts Institute of Technology, unveiled a novel technique for predicting future hurricane activity this week. The new work suggests that, even in a dramatically warming world [IF that were to happen], hurricane frequency and intensity may not substantially rise during the next two centuries.”
The published study can be found here.

The Temperature Data
Mr. Wallace questions the temperature trends asserted by Dr. Savage to have occurred since 1998 and 2001.

The accuracy of each assertion from Dr. Savage can be verified here. From that link, readers can easily trace the data back to the original source.

Current mean temperatures are further put into context in this post.

Atmospheric CO2 is put into context here.

The Credentials of the Skeptics
The credentials of the most notable 32,000 skeptics can be found right here.

If Mr. Wallace suffers from the delusion that all scientists listed as having participated in any given IPCC report are in agreement with what the IPCC politicians publish, he should watch these videos featuring interviews with former lead authors for the IPCC.

Paul Hawken & “global weirding”?
It is ironic that Mr. Wallace questions the credentials of climate skeptics and then cites Paul Hawken as someone he finds credible.

In his own biography, Mr. Hawken mentions absolutely nothing about any formal education.

A brief search for what Paul’s education might be revealed only this from Wikipedia:

“At age 20, he moved to Boston to study macrobiotic philosophy under Michio and Aveline Kushi.”
So, Hawken is representative of the credentials Mr. Wallace requires in order to embrace something like Mr. Hawken’s “global weirding” religion? Somehow, I am not surprised!

Isn’t “global weirding” nothing more than what the planet has experienced for billions of years?

GIMMIE A BREAK!
Click here to learn more.


Friday, August 8, 2008

Is Strobe Talbott a Climate Expert?

SP&T alleges (without quotes) that Clintonista Strobe Talbott said:
“Only quick, decisive action can prevent carbon dioxide levels in the atmosphere
from reaching a tipping point where climate change is irreversible”

Click the image and read the story:
Click the image and read the story


REALLY?

The following chart was copied directly from Geocarb III (page 20, as Adobe Acrobat sees it). Geocarb III was originally published in the American Journal of Science, Vol. 301, February 2001, P.182-204.

Click the image to enlarge:
Click the image to enlarge
Note that both Geocarb III and the older Geocarb II are graphed.


The raw data from Geocarb III are found in this file downloaded from this NOAA page.

According to Geocarb III, “RCO2” is:

“the ratio of mass of CO2 in the atmosphere at time t divided by the mass at present”
In plain language, the above chart shows how many times higher than today CO2 was how many millions of years ago.

According to the above chart from Geocarb III, past CO2 levels have been at LEAST 11 times higher than today (more likely 26 times higher than today). Why did this mythical “tipping point” not occur then?

If we continue on our present course, by 2100 we MIGHT wind up with an RCO2 of 2 (twice the pre-industrial level of CO2). We are currently at an RCO2 of about 1.28 (28% increase relative to pre-industrial levels).

According to the above chart from Geocarb III, about 460 million years ago (during the late Ordovician), CO2 levels were at LEAST 8 times higher than today (RCO2 of 8). And yet, at that very same time, quoting this source:

“the Ordovician ended in a brief (300-500 ky), but severe, ice age… As a natural consequence, a good deal of attention has been focused on the causes of the Ordovician Ice Age. In fact, it is not easy to see how an ice age could have occurred. Atmospheric carbon dioxide levels are believed to have been 8 to 20 times their current values.”
Actually, as the Geocarb III chart clearly shows, the CO2 levels at the time of the Ordovician Ice Age were more like 8 to 30 times (or MORE) their current values!

There is, by the way, very broad agreement that a severe ice age took place about 460 million years ago in the late Ordovician.

In the previous link, readers will find various assertions that this contradiction has been resolved. But, any application of critical thinking proves those assertions to be pure bunk! Any way you slice it, you STILL wind up with a severe Ice Age taking place when CO2 levels were at LEAST 8 times higher than today!

The answer to this apparent contradiction is pretty simple. Once one looks past the propaganda and examines the peer reviewed science as published in the peer reviewed science journals (especially the most recent examples) it is glaringly obvious that CO2 is a very MINOR bit player among the various other forcing factors which drive Climate Change. And, it is glaringly obvious that there is no such “tipping point” where CO2 causes “runaway global warming”!

All of the above points are driven home more clearly by the following chart.
Click the image and learn more:

Click the image to learn more
Again, the CO2 data in the above chart comes from Geocarb III (aka Berner, 2001)
and can be found in this file downloaded from this NOAA page.

The temperature data comes from The Paleomap Project by Dr. C.R. Scotese,
a PhD geologist at the University of Texas at Arlington.

When I followed the instructions contained in Geocarb III for translating RCO2 into ppm,
the chart which I created (using the Geocarb III data file downloaded from this NOAA page) showed the exact same pattern as the above chart, but it showed even higher levels of CO2 ppm than the above chart!

This so-called “tipping point” IS A PURELY FABRICATED ALARMIST FANTASY!

Click here to learn more.


Welcome to The Colorado Energy Boom!

Updated with the latest data on 3/29/09
Welcome to The [Accelerating] Colorado Energy Boom!
Click The Image to Enlarge & View The Source:Click The Image to Enlarge And View The Source
Now, if only we could get Congressional Dems to
ALLOW US to get to work on Colorado Oil Shale!

It appears as though Dems HATE to see Americans with JOBS!

Millions are out of work.
Yet Dems continue to bow to their religious cult
rather than create even MORE good paying jobs!

THROW THE BUMS OUT!


Sunday, August 3, 2008

The Last Stand - Summary to Date

After two entries, my reading of the SP&T series titled “The Last Stand” confirms my prediction that SP&T would attempt to present the current Mountain Pine Beetle infestation as a glaring example of the allegedly unprecedented harm done by allegedly unprecedented Man Made Global Warming.

To summarize my critique to date of this series, I offer the following summary of “Inconvenient Truths”:

1) SP&T Assertion (emphasis mine):

“Throughout the continent, beetles are thriving in some altitudes and climes like never before because of higher temperatures.”
Inconvenient Truths:

A) Quoting NASA Goddard (home to Al Gore’s pal James Hansen):
“1934 is the warmest year in the contiguous states”
B) NCPA better describes what Hansen only grudgingly admits:
“Six of the top 10 hottest years occurred before 90 percent of the growth in greenhouse gas emissions during the last century occurred.”
(Note: I assume this applies only to “the contiguous states”)
C) Peer reviewed Ice Core Data suggest there were many, MANY times in the last 10,000 years (and beyond) which were warmer than today.

Notably, there was a period of AT LEAST 257 years (from 4,452 years ago to 4,295 years ago) when temperatures appear to have been consistently higher than today. (Any number higher than 0.2 in the rightmost column of this file indicates a temperature higher than the current mean temperature.) More details here.

2) SP&T Assertion (emphasis mine):
“mountain pine beetle will kill approximately 76 percent of mature lodgepole pine by 2015”
Inconvenient Truth (directly related to the first set of Inconvenient Truths):

Click the image to view a quote
from this source (page 3, Summary):

Click this image to view the quote


Click here for the rest of my observations on the SP&T series “The Last Stand”.

Click here for the primary arguments against Man Made Global Warming Hysteria.